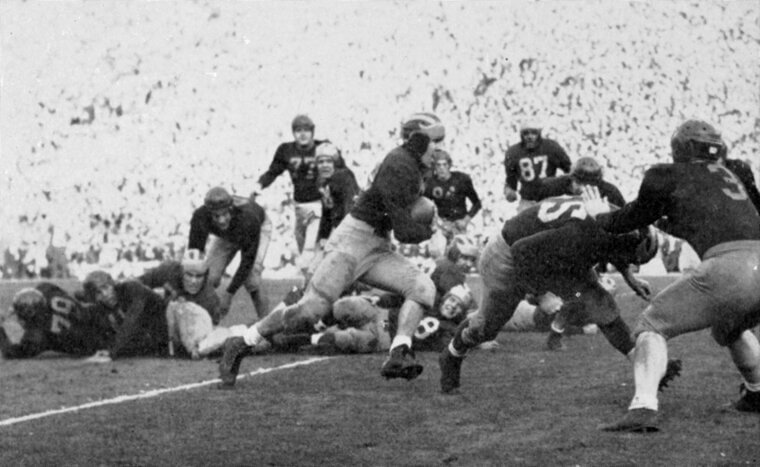
1938
In 1938, the minimum wage was $0.25! While this may seem like a very small amount, it is actually the equivalent of $5.75 in today's economy - which, to be fair, is still pretty low. However, it's also worth remembering that things simply didn't cost as much back then, as inflation wasn't as much of an issue.

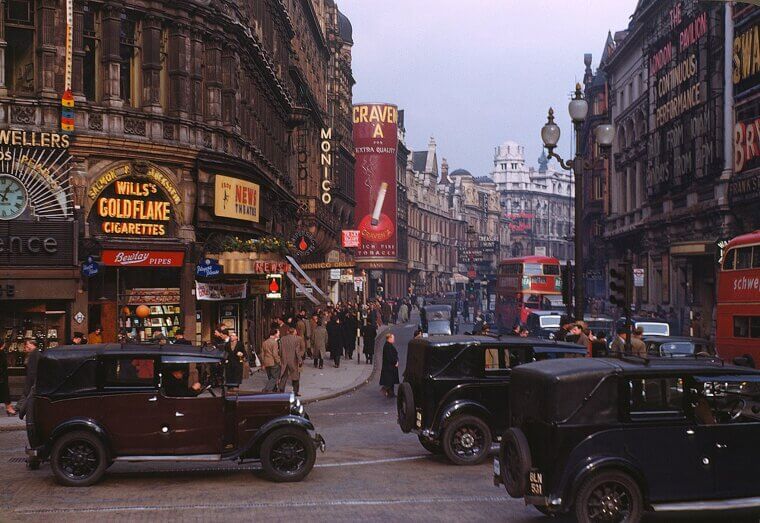
1939
By 1939, the minimum wage had increased to $0.30 or the equivalent of $7.01 in today's economy. This was still reasonably low, which made it rather difficult for entry-level workers to afford basic goods and services. The world was also on the verge of World War 2, which had a massive effect on the global economy.

1943
In 1943, the minimum wage of the country remained at $0.30. However, unlike previous years, the value of this $0.30 had dropped compared to other currencies - mainly as a result of the war.
1945
By the end of the war, the minimum wage of the country still remained at $0.30 or the equivalent of $7.22 in today's economy. Minimum wage tends to increase steadily year by year. However, due to the global unrest, people simply couldn't afford to pay more, which accounted for the minimum wage stand-still betweem 1939 and 1945.
1946
In 1946, the minimum wage had increased to $0.40 per hour. The world was still dealing with the after effects of World War 2, but the US ultimately dominated the global market. However, poverty-stricken Americans and entry-level workers still suffered from a low minimum wage standard in a rapidly evolving economy.
1947
While the minimum wage remained steady at $0.40 in 1947, the overall value of this amount started to decrease. While it had previous been worth around $7.00 in today's economy, it was now only the equivalent of $5.80.

1948
In 1948, the minimum wage remained at $0.40 per hour and people started to struggle financially because of it (especially lower class Americans). More so, the value of the dollar continued to drop, making the situation even more dire.
1949
Things finally started to look up towards the end of 1949, even though the minimum wage remained at $0.40 per hour. The value of the dollar was on the rise once again, providing some much-needed relief to entry-level workers.
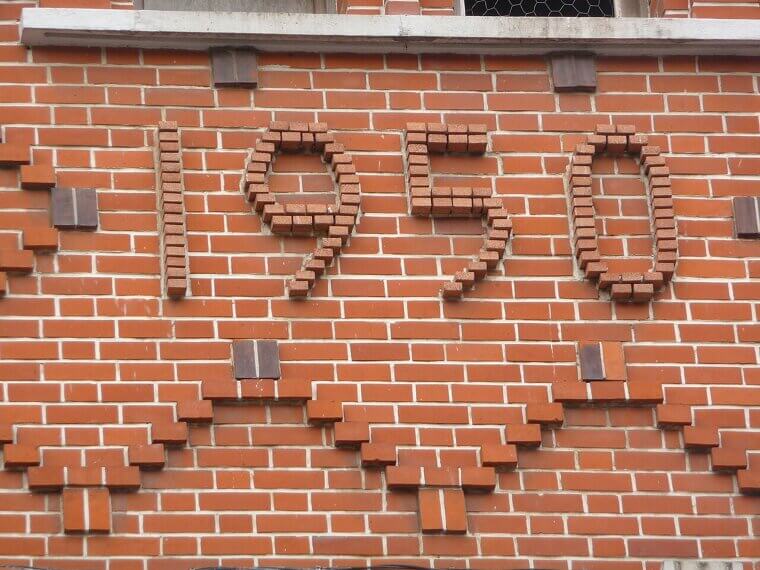
1950
In 1950, the minimum wage of the country jumped up to $0.75 per hour or the equivalent of $10.11 in today's economy. Even today, the minimum wage fluctuates around $9 and $11, showcasing just how impressive the value for money was back in 1950.
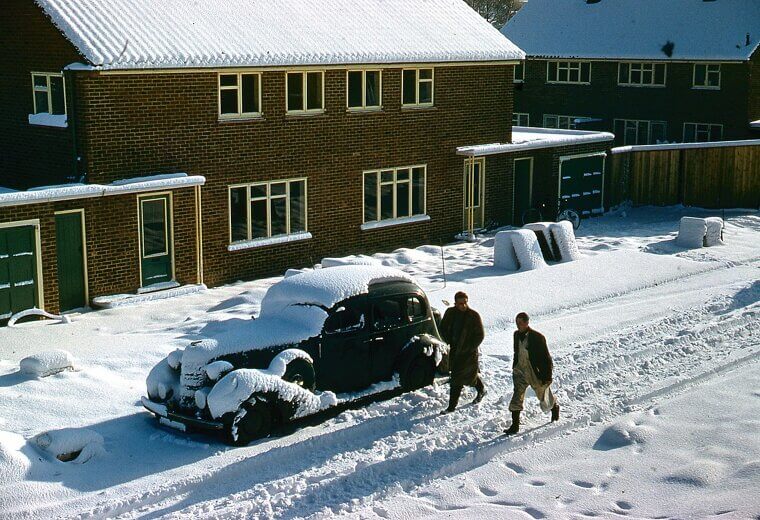
1955
The minimum wage remained strong at $0.75 in 1955, even though the value of the dollar did stat to drop slightly. This $0.75 was worth the equivalent of $9.09 in today's economy, showcasing the strong-hold America continued to have on the global market.
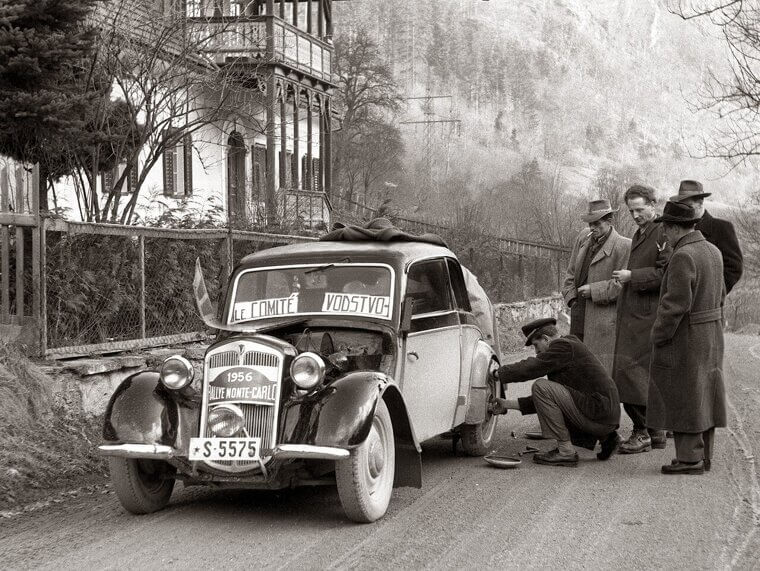
1956
In 1956, the minimum wage had finally reached the $1.00 mark - for the first time in history. In today's economy, this would be worth roughly $11.94! The dollar was just about the strongest it had ever been around this time and the minimum wage standard reflected this.
1960
The minimum wage of the country remained strong at $1.00 in 1960. However, it's value did start to drop ever so slightly, with the $1.00 being the equivalent of $10.97 in today's economy.
1961
In 1961, the minimum wage of the country increased to $1.15 - a massive jump for the time. In fact, this $1.15 was worth the equivalent of $12.50 in today's economy, which is, to this day, one of the highest minimum wages there has ever been.
1963
Thrroughout the early 1960s, the value of the dollar, and therefore the minimum wage standard, continued to increase. In 1963, the minimum wage was recorded to be $1.25 or the $13.27 in today's economy.
1967
By 1967, the minimum wage of the country had increased a further $0.15 per hour, sitting at $1.40. In today's economy, this was the equivalent of roughly $13.60, showcasing just how strong the American economy was at the time. What's more, it would only go on to get even stronger in the coming years.
1968
In 1968, the minimum wage jumped once again, reaching $1.60 per hour or $14.98 in today's economy! This was an all-time high and, to this day, is one of the highest ever recorded minimum wage standards ever reached by the United States of America.
1973
By 1973, the value of dollar had started to drop once again. So, even though the minimum wage remained at $1.60 per hour, it no longer went as far as it once did. In just, in today's economy, the $1.60 would be worth $11.70 - more than $3.00 less than 1968.
1974
In 1974, the minimum wage underwent yet another massive increase, jumping from $1.60 the previous year to $2.00. More so, the dollar was worth more than the previous year, with the minimum wage equating to $13.18 in today's economy.
1978
In 1978, the minimum wage in the country began nearing $3.00 - just a few years after reaching the $2.00 mark. To be more specific, it was set at $2.65 or $13.20 in today's economy. The value of the dollar was holding pretty steady around this time as one of the strongest currencies in the world.
1980
By 1980, the minimum wage had finally surpassed $3.00, sitting at $3.10 per hour. However, the value of the dollar had dropped slightly, meaning that this $3.10 would be worth around $12.22 in today's economy.
1982
In 1982, the minimum wage standard had reached $3.35, but the value of the dollar was steadily decreasing. However, it was still pretty strong at the time, with the minimum wage equating to about $11.27 in today's economy.

1984
The minimum wage across the country held steadily in 1984, sitting at $3.35. However, the value of the dollar had started to drop significantly compared to the years prior, which ultimately started to effect lower-class and entry level workers. Simply put, the money was no longer going as far, with basic goods and services costing more than previous years.

1986
The minimum wage remained at $3.35 throughout 1986. However, despite its consistency, the cost of everyday living grew, making it harder and harder for entry level workers to afford basic goods and services. In other words, the cost of living inceased, but people weren't making more.
1988
The minimum wage in 1988 was still $3.35, with the value of the dollar dropping steadily. In today's economy, this $3.35 would equate to roughly $9.20 - the lowest it had been in years. To make matters worse, the cost of living was still on the rise.

1989
The minimum wage remained constant at $3.35 in 1989. Continuing the trend, the value of this money only got less and less, equating to just $8.77 by the end of the year.
1990
Finally, after years of remaining constant at $3.35, the minimum wage standard finally increased in the new decade. In 1990, it surged to $3.80 - the equivalent of $9.44 in today's economy. This was a massive relief to entry level workers and the lower class in particular.
1991
In 1991, the minimum wage increased massively to $4.25. However, the value of the dollar dipped slightly, which meant that it only increased by a few cents relative to today's economy. Either way, this increased reflected an improved standard of life for many American citizens.
1992
In 1992, the minimum wage standard remained the same at $4.25. However, the dollar dipped in value once again, meaning that the $4.25 would only have been the equivalent of $9.84 in today's economy. With the cost of living and inflation being an ever-increasing problem for everyday Americans, the minimum wage standard simply didn't seem to keep up.

1994
Over the next two years, the minimum wage in the country remained the same : $4.25 per hour. In today's economy, this would have been the equivalent of roughly $9.31 per hour - the lowest it had been in years. Despite inflation and cost-of-living increases, no adjustments were made that year, prompting debates about wage stagnation and its impact on low-income workers

1995
In 1995, the U.S. federal minimum wage remained at $4.25 per hour. Despite growing concerns over wage stagnation and inflation, no legislative action was taken to raise the rate. This sparked a nation-wide debate and outrage, with labor advocates demanding an increase in order to support low-income workers amid rising living costs.
1996
In 1996, the minimum wage in the country finally increased from $4.25 to $4.75 per hour - but only towards the end of the year. In today's economy, this would equate to about $9.83 per hour. This was the first raise since 1991, an issue that affected nearly 10 million workers. The wage hike was aimed at improving earnings for low-wage workers.

1997
Like in 1996, the minimum wage in the USA underwent a further increase in 1997, sitting at $5.15. This two-step hike, planned by the government, aimed to boost earnings for low-wage workers.Overall, more than 10 million workers benefited from the increase, drastically reducing poverty in the country, as wall as increasing the overall quality of life for the average citizen.
2006
The minimum wage of the country remained at $5.15 for almost ten years following the 1996-1997 two-step hike implementation. In 2006, this $5.15 was worth the equivalent of $8.30 in today's economy. Despite inflation and rising living costs, no legislative action was taken to increase it. About 409,000 hourly workers earned earned this wage.
2007
In 2007, the minimum wage rate increased for the first time in a decade. The Fair Minimum Wage Act raised it from $5.15 to $5.85 per hour, equating to roughly $9.16 in today's economy. This was the first of three scheduled hikes, aiming to reach $7.25 by 2009. More so, this new minimum wage rate was extended to the American territories.

2008
In 2008, the minimum wage was increased once again - this time from $5.85 to $6.55 per hour or the equivalent of $9.88 in today's economy. This hike served as the second of three scheduled increases under the Fair Minimum Wage Act of 2007. It aimed at supporting low-income workers amid rising living costs. A total of 280 000 worked earned minimum wage that year.

2009
The last of the three planned minimum wage hikes was implemented in 2009, increasing from $6.55 to $7.25. Additionally, this was the first year in over a decade that the equivalent value surpassed $10.00. The wage hike made a massive difference in improving the overall quality of life for everyday Americans.
2012
In 2012, the U.S. minimum wage remained at $7.25 per hour (or the equivalent of $10.26 in today's economy), unchanged since 2009. About 1.6 million workers earned this rate, while 2 million people actually earned less due to exemptions. Once again, the stagnant minimum wage rate sparked outrage and debate from the public, as it massively affected the quality of life of millions of Americans.
2013
In 2013, the minimum wage in the country remained the same: $7.25 or the equivalent of $10.11 in today's economyy. At the time, roughly 1.5 million workers earned this rate.

2014
The minimum wage in the USA remained unchanged in 2014, equating to roughly $9.95 in today's economy.